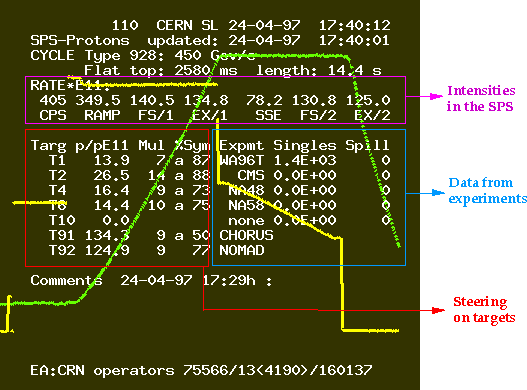
Page-1 is
available on television screens in the experimental barracks, control rooms and
in various places all over the CERN site. A typical example during a fixed
target proton run (numbers invented) could look as follows:

The information is grouped in various blocks:
CPS : The number of protons per SPS pulse leaving the PS. Calculated
from PS transfo readings (difference before and after extraction).
RAMP
: The number of protons per pulse accelerated to 440 GeV/cy.
FS/1
: The first fast-slow extraction to T9/1 from BCT in ring, calculated from
the intensity difference before and after extraction.
EX/1 : Idem, but
measured with the fast/slow BCT in the TT60 line.
SSE : The amount of
protons used for slow extraction to fixed target experiments behind T1, T2, T4
and T6.
FS/2 : As FS/1, but for the second fast-slow
extraction.
EX/2 : As EX/1, but for the second fast-slow
extraction.
Intensity : The number of protons sent towards the primary target in
units of 1011 protons per spill. The desired intensity per target is
defined by the SPS coordinator and indicated on the SPS
schedule.
Multiplicity: The ratio between the numbers of charged
particles detected upstream of the target (= Intensity) and by a detector
downstream of the target. This ratio depends on the length of the target, on the
acceptance of the downstream detector and on calibration factors for the
monitors. A multiplicity of ~ 1 implies that the beam misses the target.
Mostly long targets are used and typical multiplicities should be between 10 and
20.
Symmetry: The symmetry is measured by two sets of split foil
monitors. The horizontal symmetry (SH) is defined as SH = 100% - AH
where AH = 100% x (Left - Right) / (Left + Right).
Similarly for the vertical symmetry. The overall symmetry S is then defined as
S = ((SH2 + SV2)/2)0.5.
NEW : For the targets T1, T2, T4, T6 the definition of
symmetry has been generalised to include the angular steering in the
symmetry. The new formula will be
S = 100% . (SH . SV .
BH . BV)n, with n=0.5 and BH and BV the symmetries
measured at a split foil located some 30 metres upstream of each target.
The
angular steering is included in the symmetry only if an 'a' is shown in
front of the symmetry. If
the 'a' does not appear, the old type of symmetry (without angle) is
provided.
Good steering implies a symmetry better than 80%. including the 'a'
Intensity: From the so-called 'neutrino-BCT' in TT60, not far from T9.
The SEM intensities measured at T9 are not shown, but logged in a
database.
Symmetry: As for T1, measured with the split foils at
T9.
Multiplicity: As for T1, measured with secondary emission monitors
at T9
For each main user behind a given target is shown:
Intensity : A
singles rate detected by the experiment. This rate is transmitted via an
'experimental scaler' read through the SL-EA control system.
Spill :
The effective spill observed by the experiment as calculated from the delayed coincidence of a
signal with itself. The effective spill Seff is defined as Seff = Gate x
Singles2 / Coincidence.
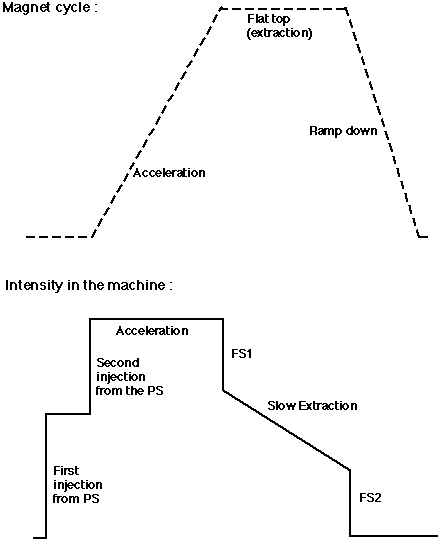
Overlayed with the alphanumeric information there are two curves. One represents the magnet cycle, the other the instantaneous intensity in the machine.
Below the interpretation of the curves is indicated. Please note that a part of the SPS cycle is dedicated to leptons only (for LEP). That fraction of the cycle is not shown on the SPS page 1. A moving vertical line shows the present time within the cycle.
